Candlestick patterns are visual signals that traders use to interpret market sentiment and predict future price action. Each candlestick represents a specific time period and shows four key data points: the opening price, closing price, highest price, and lowest price within that time frame.
The idea behind candlestick patterns is straightforward: price action often repeats itself, and the shapes that candlesticks form can give clues about whether buyers or sellers are gaining control. While no pattern guarantees an outcome, they can provide high-probability setups when combined with other technical tools.
What makes candlesticks particularly useful is how much information they convey at a glance. Instead of relying purely on indicators or lagging signals, traders can quickly scan a chart and spot formations that suggest a shift in direction or a continuation of the current trend. That’s the true value of having a candlestick cheat sheet handy—it speeds up your decision-making process while helping you avoid overanalyzing every move.
Basic Candlestick Anotomy
Before diving into patterns, it’s crucial to understand the basic structure of a candlestick. Each candle on a chart tells a mini story about price movement in a given time period.
A candlestick consists of:
- The body: This shows the range between the opening and closing prices. A green (or white) body usually means price closed higher than it opened (bullish), while a red (or black) body means the price closed lower (bearish).
- The wicks (also called shadows): These lines above and below the body represent the highest and lowest prices during that period.
- The open and close: These points show where the price started and ended during the selected time frame.
A long body suggests strong buying or selling pressure, while a short body might indicate consolidation or indecision. Similarly, long wicks may signal rejection at a price level or a possible reversal.
Knowing how to read these basic parts helps you interpret more complex candlestick formations down the line—and makes any trading chart patterns cheat sheet a lot more useful.
Single Candlestick Patterns
Let’s start simple. Some candlestick patterns consist of just one candle but can still be powerful indicators when spotted in the right context. Here are some of the most important single candle patterns every trader should recognize:
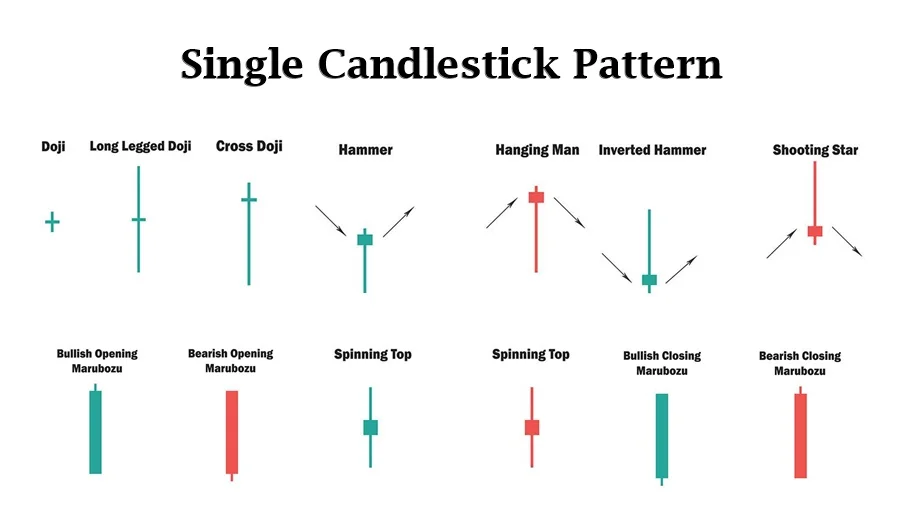
Doji
A doji forms when the open and close prices are almost the same, resulting in a very small or non-existent body. This indicates indecision in the market. Depending on where it appears in a trend, it can signal a possible reversal or a pause in momentum. Variations include:
- Long-legged doji: Strong indecision with long upper and lower wicks.
- Gravestone doji: Suggests bearish reversal, especially after an uptrend.
- Dragonfly doji: Often seen as a bullish signal after a downtrend.
Hammer and Hanging Man
These patterns look alike but appear in different contexts:
- Hammer: Appears after a downtrend and signals a possible bullish reversal. It has a small body and a long lower wick.
- Hanging Man: Shows up after an uptrend, indicating potential weakness and a bearish shift.
Inverted Hammer and Shooting Star
- Inverted Hammer: Forms after a downtrend and may signal a bullish reversal. It has a small body with a long upper wick.
- Shooting Star: Occurs at the top of an uptrend, hinting at a bearish reversal.
Bullish Candlestick Patterns
Bullish candlestick patterns are visual signals that suggest buyers may be gaining control and a potential uptrend is on the horizon. These patterns don’t guarantee price movement, but they often serve as early clues when used alongside other indicators.
Here are some of the most well-known bullish formations that belong on any solid candlestick patterns cheat sheet:
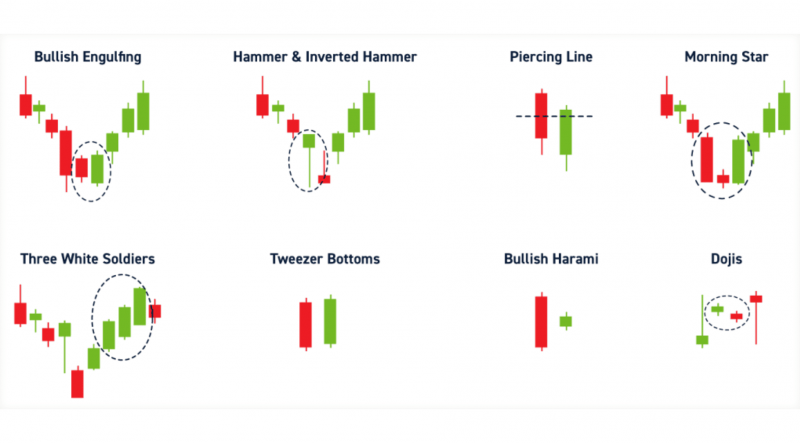
Morning Star
This is a three-candle formation that usually shows up at the bottom of a downtrend. It starts with a long bearish candle, followed by a small-bodied candle (which can be bullish or bearish), and ends with a strong bullish candle that closes above the midpoint of the first candle. Traders often interpret this as a shift in momentum from sellers to buyers.
Bullish Engulfing
A classic move where a small red (bearish) candle is immediately followed by a larger green (bullish) candle that completely “engulfs” the previous one. This suggests buyers stepped in with conviction.
Piercing Pattern
Seen during a downtrend, this two-candle pattern starts with a long bearish candle, followed by a bullish candle that opens lower but closes above the midpoint of the previous candle. It’s a sign that buying pressure may be increasing.
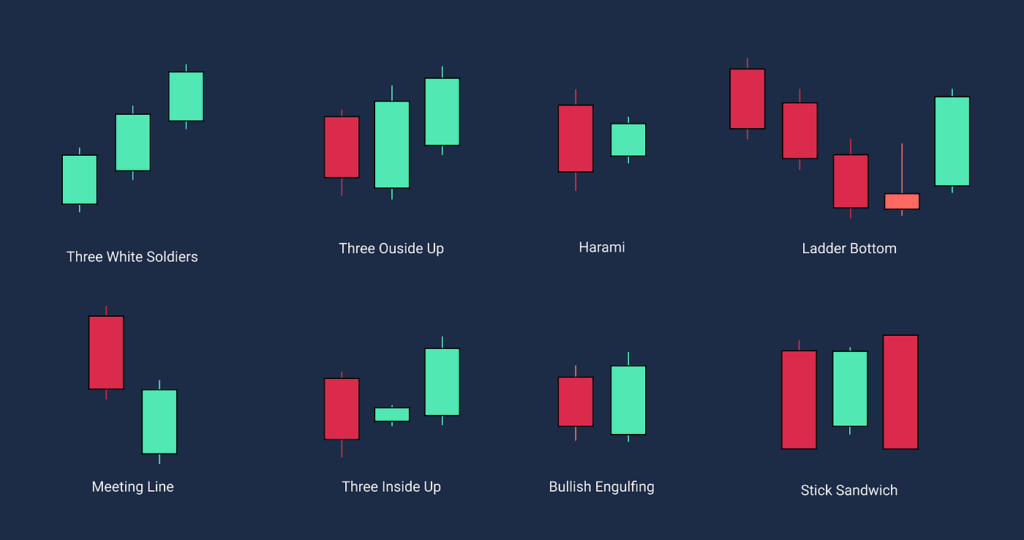
Three White Soldiers
This is a powerful signal of sustained buying. It consists of three consecutive bullish candles, each opening within the previous body and closing higher. Traders often view this as confirmation of trend reversal or strong continuation.
Bearish Candlestick Patterns
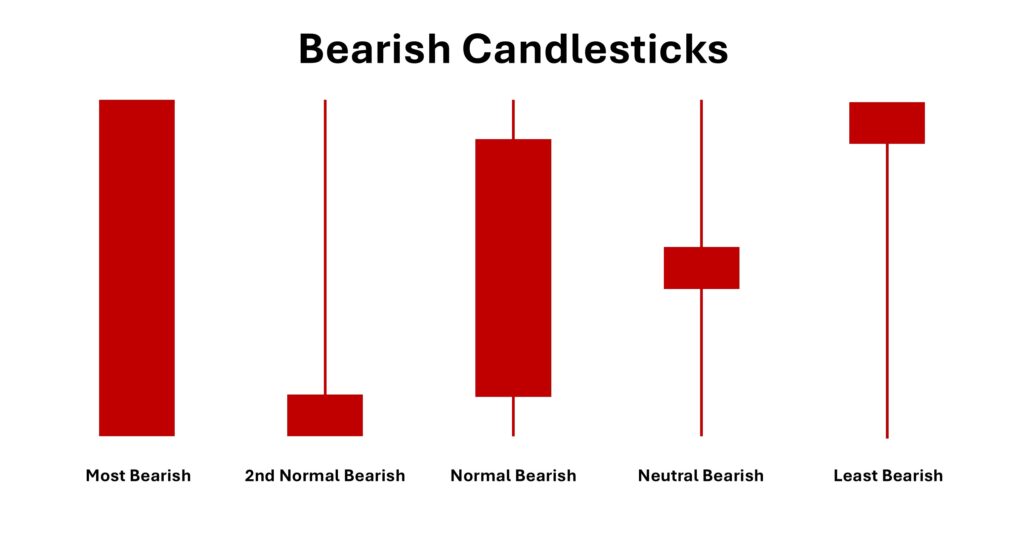
While bullish patterns point to upward momentum, bearish candlestick patterns suggest the opposite—possible weakness or a reversal from an uptrend. For traders, these signals can be critical in deciding when to reduce long exposure or consider shorting opportunities.
Let’s walk through some key bearish formations that often feature in a reliable trading patterns cheat sheet:
Evening Star
This is the bearish twin of the Morning Star. It appears at the top of an uptrend and includes a bullish candle, a small indecisive candle (often a doji), and a large bearish candle that closes below the midpoint of the first. The pattern hints that the bullish momentum is fading.
Bearish Engulfing
Here, a smaller bullish candle is followed by a larger bearish candle that wraps around the previous one. It shows that sellers have taken control and could be signaling a trend reversal.
Dark Cloud Cover
This pattern starts with a strong bullish candle, but the next day opens higher and closes well into the prior candle’s body—usually more than halfway down. It indicates a loss of buying strength and the potential return of sellers.
Three Black Crows
Three consecutive bearish candles with lower closes and small or no wicks are a sign that selling pressure is growing. This pattern is usually viewed as a strong reversal signal, especially after an extended uptrend.
Reversal Patterns
Reversal candlestick patterns are especially important because they can signal a change in trend direction—either from bullish to bearish or the other way around. Spotting them early gives traders the opportunity to prepare for a shift in momentum.
Here are some commonly referenced reversal formations:
Tweezer Tops and Bottoms
Tweezer Tops occur at the end of an uptrend, while Tweezer Bottoms form after a downtrend. Both are two-candle setups where the highs or lows of both candles match almost perfectly. These suggest price rejection and a potential turning point.
Bullish & Bearish Harami
In a Bullish Harami, a small bullish candle fits inside the body of a previous larger bearish candle. A Bearish Harami does the opposite: a small bearish candle inside a larger bullish one. The pattern implies a pause or hesitation in the current trend and often leads to reversals, particularly when confirmed with volume shifts or support/resistance zones.
Abandoned Baby
A rare but strong signal. It consists of three candles: a trend candle (bullish or bearish), a doji that gaps away from the previous candle, and a reversal candle that gaps in the opposite direction. The isolated doji represents a strong indecision that can lead to a trend flip.
Continuation Patterns
Not every pattern signals a reversal. Sometimes, price pauses for a moment before continuing in the same direction. These are known as continuation patterns. They help traders avoid false exits and stay in profitable trades longer.
Here are two commonly used bullish and bearish continuation patterns you’ll find on any detailed candlestick patterns cheat sheet:
Rising Three Methods
This pattern starts with a long bullish candle, followed by several small-bodied candles that move slightly lower—but remain within the range of the first candle. The pattern ends with another strong bullish candle that breaks above the first candle’s high. It signals that the bulls are taking a breath, not backing down.
Falling Three Methods
The bearish counterpart. It begins with a long red candle, then features a few small bullish candles that stay inside the first candle’s range. The pattern ends with another strong bearish candle that continues the downtrend. It shows that sellers remain in control despite minor buyer attempts.
Continuation patterns like these are most reliable when they occur in the middle of a strong trend. They also tend to work better with confirmation from other tools like volume indicators or moving average crossovers. A trading chart patterns cheat sheet is a great way to memorize these setups so you can act quickly when they appear on your charts.
Using Candlestick patterns in Trading
So how do you actually use all of this in a real trade?
Recognizing a pattern is one thing. Knowing what to do with it is another. Here’s how experienced traders make the most of candlestick signals:
- Don’t Rely on One Candle Alone: Even the strongest pattern isn’t 100% reliable. A single bullish engulfing candle doesn’t mean the market will go up forever. Use confirmation tools like RSI, MACD, Fibonacci retracements, or trendlines to double-check your entry idea.
- Understand Context: A hammer pattern near a support level means more than a hammer floating in the middle of a sideways market. Always consider where a pattern is forming—not just what it looks like.
- Combine with Your Strategy: Whether you’re day trading, swing trading, or investing long term, candlestick patterns should support your strategy, not replace it. For example, a swing trader might wait for a reversal signal at a key daily level before placing a trade.
- Backtest Before You Rely On It: Try going back on your charts and spotting past examples of these patterns. How often did they “work”? Did you notice anything that helped or hurt their accuracy?
Having a printed or digital candlestick cheat sheet nearby can really help, especially in fast-moving markets. It keeps your analysis grounded and helps you avoid rushing into decisions based on vague price movements.
Advanced Candlestick Patterns
Once you’ve mastered the basics, it might be time to explore more complex formations. These aren’t as common, but they can offer strong trading signals when they appear—especially for experienced traders who understand context.
- Island Reversal: This pattern involves a gap on both sides of a single candle or group of candles, leaving them isolated like an “island.” It suggests a sharp reversal is about to happen. Island reversals are often seen around major news events or at the end of long trends.
- Kicker Pattern: Highly aggressive and dramatic. A kicker involves a huge candle that moves sharply in the opposite direction of the previous candle, typically with a visible gap. For example, a strong bullish candle immediately following a bearish one—with no overlap. It signals a clear shift in sentiment.
- Deliberation Pattern: A more subtle three-candle formation found in strong trends. The first two candles show continuation, but the third slows down with a smaller body. It’s a sign that momentum might be fading, and a reversal or pullback could be near.
These advanced setups are harder to spot, but they’re powerful. Keep them on your trading patterns cheat sheet as your skills progress. They can offer early warning signs or confirm what you’re already seeing from other tools.
Candlestick patterns offer a visual language of market psychology. They won’t predict the future, but they help you understand what buyers and sellers are doing—and what might come next. Keeping a clear and well-structured candlestick patterns cheat sheet handy allows you to spot opportunities with more confidence.
Always remember: patterns are tools, not guarantees. Use them as part of a broader strategy, respect your risk limits, and keep learning through practice. Whether you’re a beginner or an advanced trader, being fluent in candlestick signals is one of the most valuable skills you can develop in Forex and beyond.