When it comes to trading, timing is everything. But what if there was a tool that could help you better understand where the price might turn, pause, or push forward? That’s exactly where Fibonacci retracement comes in.
This widely used technical analysis tool is based on a series of mathematical ratios that occur throughout nature—and, interestingly, in the behavior of financial markets. Traders use it to identify potential support and resistance levels during price corrections, giving them a clearer picture of possible market entry or exit points.
In this guide, we’ll walk you through how to use Fibonacci retracement, explain why so many traders trust it, and break down the levels that matter most. Whether you’re new to trading or looking to sharpen your chart analysis, understanding Fibonacci retracement can add serious structure to your strategy.
What is Fibonacci Retracement?
At its core, Fibonacci retracement is a method of technical analysis that uses horizontal lines to indicate areas of potential price reversal. These lines are drawn based on the Fibonacci sequence—a series of numbers where each one is the sum of the two preceding it (1, 1, 2, 3, 5, 8, 13, and so on).
But how does that relate to trading?
The key lies in the ratios derived from this sequence: 23.6%, 38.2%, 50%, 61.8%, and 78.6%. These are known as retracement levels. When a market makes a strong move in one direction (either up or down), it often pulls back—or retraces—a portion of that move before continuing in the original direction. Fibonacci retracement levels help you estimate where these pullbacks might end.
In practice, traders use charting tools to apply these levels to recent price highs and lows. The idea is that the price might find temporary support or resistance at these key levels, giving traders a chance to plan their next move.
Why Use Fibonacci Retracement in Trading?
There are plenty of tools in a trader’s kit, but using Fibonacci retracement offers a specific edge—it helps you frame the market in a structured, consistent way.
Markets don’t move in straight lines. After a price surge or drop, it’s common to see a correction. This is where Fibonacci retracement becomes valuable. It gives you a sense of where that correction might pause, allowing you to make more informed decisions about entries, exits, or even stop-loss placements.
Here’s why traders rely on it:
- Psychological relevance: These levels are widely watched. Because many traders use them, they often become self-fulfilling support or resistance zones.
- Visual clarity: The retracement tool adds structure to a chart. It’s easier to spot potential turning points when the levels are mapped out.
- Cross-market application: Whether you’re trading forex, stocks, commodities, or crypto, the retracement principles apply the same way.
That said, it’s not magic. It’s a guide. And like all tools, it works best when combined with other forms of analysis—like trendlines, candlestick patterns, or volume indicators.
Key Fibonacci Retracement Levels Explained
Now let’s dig into the levels themselves. When you apply Fibonacci retracement to a chart, the tool draws horizontal lines at specific percentages of the price range you selected. These percentages correspond to the Fibonacci ratios.
Here’s what each level generally suggests:
- 23.6% – This is a shallow retracement, often seen in strong trends. If the price only pulls back to this level and continues, it signals strong momentum.
- 38.2% – A moderate correction. This level is commonly watched by traders expecting a continuation of the trend after a brief pause.
- 50% – Not technically a Fibonacci number, but widely used. It reflects the idea that a healthy market correction often retraces about half of the previous move.
- 61.8% – The “golden ratio” and arguably the most important level. Many traders believe that if a price retraces to this level and holds, the original trend is likely to resume.
- 78.6% – A deeper retracement level. If the price still reverses from here, it often leads to a strong move in the original direction.
Keep in mind that fibonacci retracement levels aren’t exact science—they’re zones, not exact points. Market behavior often respects these areas loosely, so don’t be surprised if the price pierces a level before reversing.
In the next section, we’ll explain how to draw Fibonacci retracement on a chart and how to interpret those levels in real time.
How to Draw and Use Fibonacci Retracement Levels On a Chart
Understanding how to draw Fibonacci retracement is essential if you want to make the most out of this tool. While most charting platforms (like MetaTrader, TradingView, or Thinkorswim) offer a built-in retracement tool, the key is knowing where and when to use it.
Here’s a step-by-step breakdown:
- Identify a clear trend – You need a noticeable move, either upward or downward. The more obvious the trend, the more reliable the retracement.
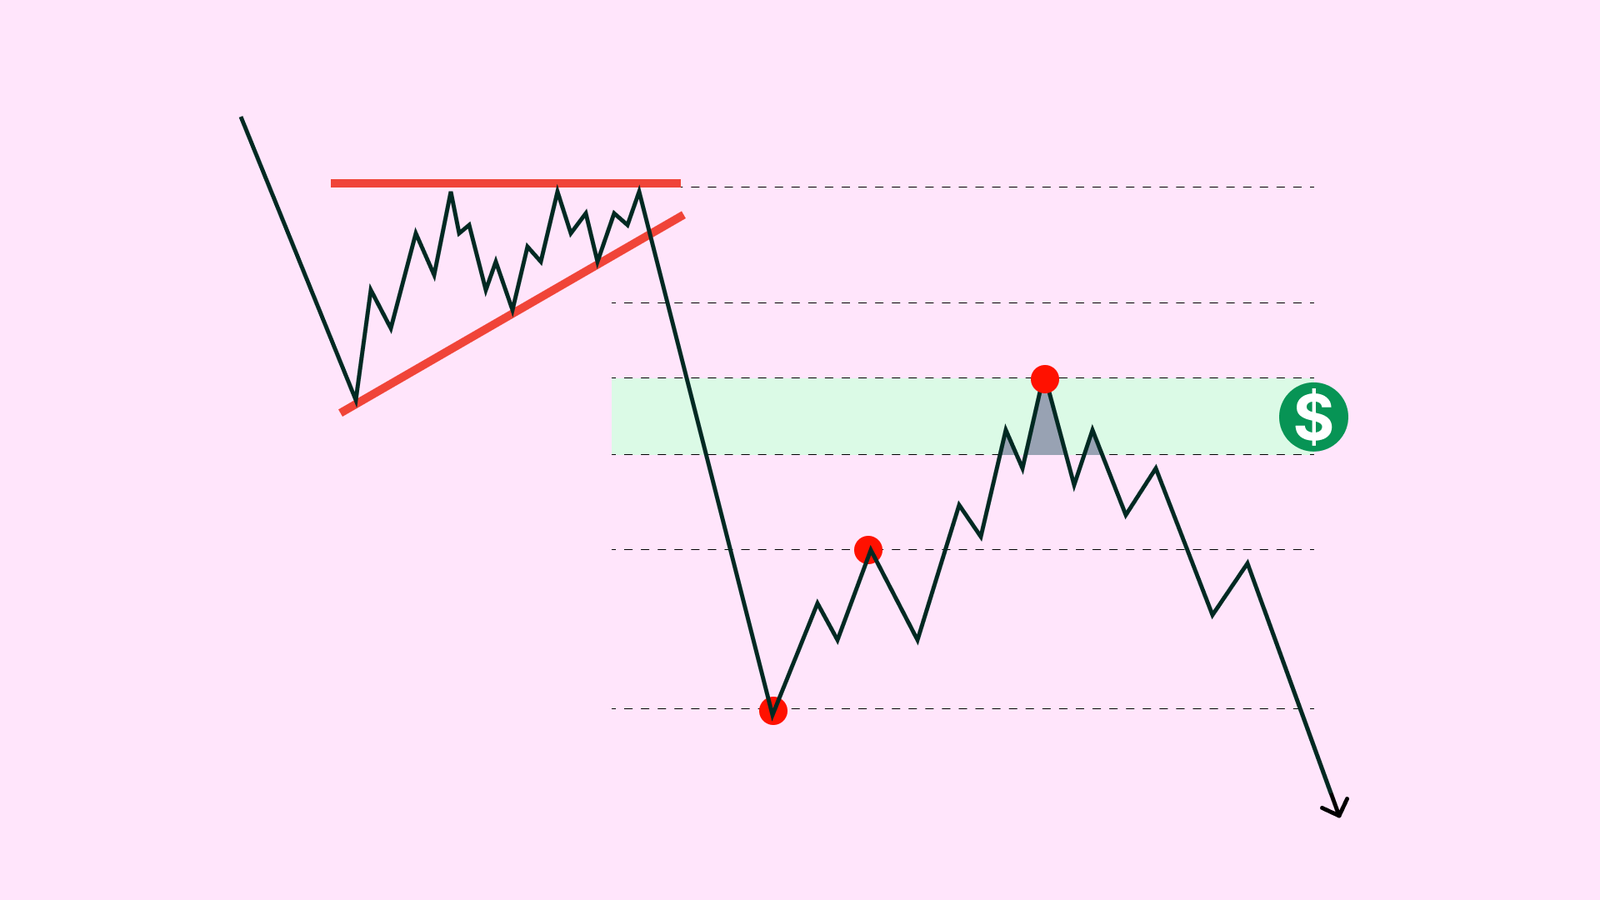
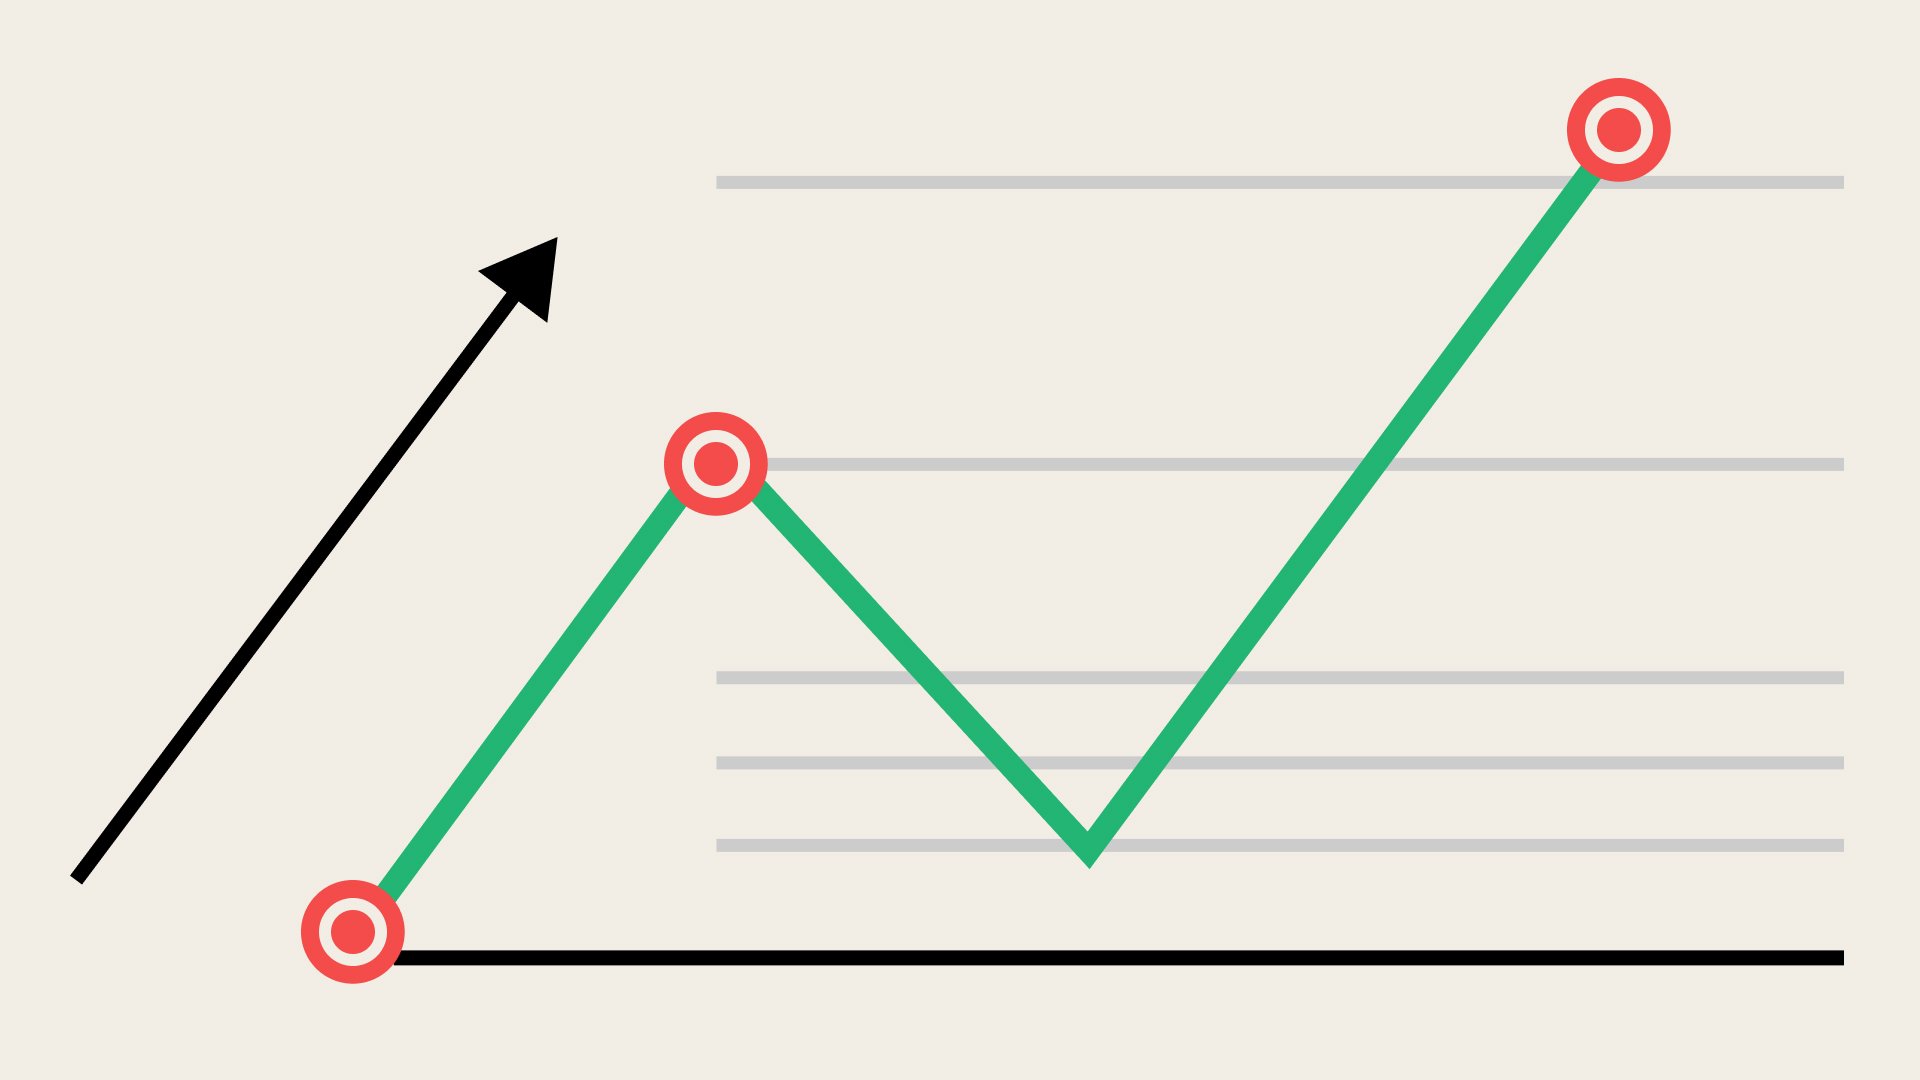
- Find the swing high and swing low – In an uptrend, draw the retracement from the lowest point (swing low) to the highest point (swing high). In a downtrend, you do the opposite—from swing high to swing low.
- Let the tool plot the levels – Once applied, the tool will automatically draw horizontal lines at 23.6%, 38.2%, 50%, 61.8%, and 78.6% of the move.
- Watch for price behavior at each level – These aren’t entry signals by themselves. Instead, they highlight zones where you should look for confirmation—like a candlestick reversal or volume spike.
For example, in an uptrend, if the price pulls back to the 61.8% retracement level, then forms a bullish engulfing candle and starts to rise again, it may suggest the continuation of the upward move.
Don’t forget: how to use Fibonacci retracement is not just about drawing lines. It’s about interpreting what happens around those levels.
Advanced Tips for Using Fibonacci Retracement
Once you’re comfortable with the basics, it’s time to refine your approach. These techniques can help make your use of Fibonacci retracement more precise and aligned with broader market behavior.
- Combine with trendlines and support/resistance: Fibonacci works best when it overlaps with other technical levels. If the 38.2% retracement coincides with a previous support zone or ascending trendline, the area becomes more significant.
- Look for confluence zones: When multiple indicators or price tools align at a single price level, the likelihood of a bounce or reversal increases. Combine Fibonacci levels with moving averages (like the 200 EMA), RSI signals, or Bollinger Bands.
- Use it with candlestick patterns: Reversal patterns like hammers, doji, or engulfing candles near retracement levels can serve as powerful confirmation tools.
- Be cautious in ranging markets: Using Fibonacci retracement works best in trending markets. In sideways or choppy conditions, price may break through levels without offering clear reactions.
- Adjust to different timeframes: Retracement levels can work across intraday, daily, or weekly charts. However, always be mindful of the time horizon that aligns with your trading strategy. A 61.8% retracement on a 4-hour chart might mean little to a long-term investor but could be crucial for a day trader.
Case Studies: Real-World Examples of Fibonacci Retracement in Action
To see the value of Fibonacci retracement in practice, let’s look at a couple of real-life chart scenarios from the forex and stock markets.
Example 1: EUR/USD 4-Hour Chart
In a recent bullish run, EUR/USD climbed from 1.0800 to 1.1100 before pulling back. Traders drew the Fibonacci retracement from the low to the high of this move. The price retraced to the 61.8% level around 1.0920, then formed a strong bullish candle. From there, the pair resumed its upward move—eventually retesting the 1.1100 high.
Why it worked:
The 61.8% level coincided with a previously broken resistance that had turned into support. A classic example of technical confluence.
Example 2: Tesla (TSLA) Daily Chart
After a breakout above $200, Tesla stock surged to $260 before correcting. Traders applied Fibonacci from $200 to $260. The price pulled back to the 50% level ($230), paused, and then bounced. Over the next week, TSLA climbed back above $250.
Lesson learned:
Even in volatile markets, retracement levels can help outline clear risk/reward opportunities.
In both examples, the key was not just drawing the levels, but waiting for price action to validate them.
If you’re just getting started, practice drawing retracement levels on historical charts and observe how the price interacts with them. With time and consistent use, you’ll develop a more intuitive sense of how using Fibonacci retracement fits into your trading strategy.